The tool

From activity data to a reportable number

CS3 compares a business-as-usual baseline against a circular scenario across the Scope 3 categories. Furthermore, it now puts the economic cost of each strategy right next to its carbon result. The screens below are from the live tool, running on a fictional mid-size injection moulder company, built to be dimensionally realistic for the sector. Every figure is computed by the tool.

Measure the delta

Results screen for the demo company: a business-as-usual baseline of 45,007 t CO2e against a circular scenario of 34,634 t — a 23.0% reduction — with buttons to download a PDF and export ESRS E1 data. Add figures/tool-results.jpg
the results overview screen
The headline result: baseline versus circular across the whole assessment. One-click export to PDF and to ESRS E1. Sample data shown.

See how every category performs

Emissions by Scope 3 category, baseline versus circular, across eight categories — purchased goods dominates at 56% of the footprint, end-of-life is second, and capital goods is the one category whose circular bar is longer than its baseline. Add figures/tool-categories.jpg
the per-category breakdown screen
Every Scope 3 category, baseline against circular: reductions and increases shown in green and grey respectively. Sample data shown.

Rank the circular strategies

Strategy prioritisation: six circular strategies ranked by a composite impact score out of 100, with those that increase emissions in some categories flagged, followed by implementation notes. Add figures/tool-prioritisation.jpg
the strategy-prioritisation screen
From measurement to decision: the top-ranked strategies, scored on net impact, effectiveness and uniqueness, and flagged where one raises emissions elsewhere. Sample data shown.

Does it pay back?

Economics screen: 7.18 million euro total CapEx, 2.40 million euro net annual benefit, 11.33 million euro portfolio NPV and a portfolio abatement cost of minus 141 euro per tonne, with strategies ranked cheapest-abatement-first. Add figures/tool-economics.jpg
the economics screen (new)
Payback, NPV and marginal abatement cost in €/tCO₂e: “does it pay back?” sits beside “how much carbon does it save?” Sample data shown.

Does it get you to target?

Progress toward an SBTi target: the assessed reporting period drawn as a solid line down from a 45,007 t baseline, then a dashed projection holding at a 26,104 t target — a 42% absolute reduction by 2030. Add figures/tool-sbti.jpg
the SBTi progress screen
The question behind the target: this portfolio closes 55% of the reduction a 42%-by-2030 SBTi target requires.

Is it disclosure-ready?

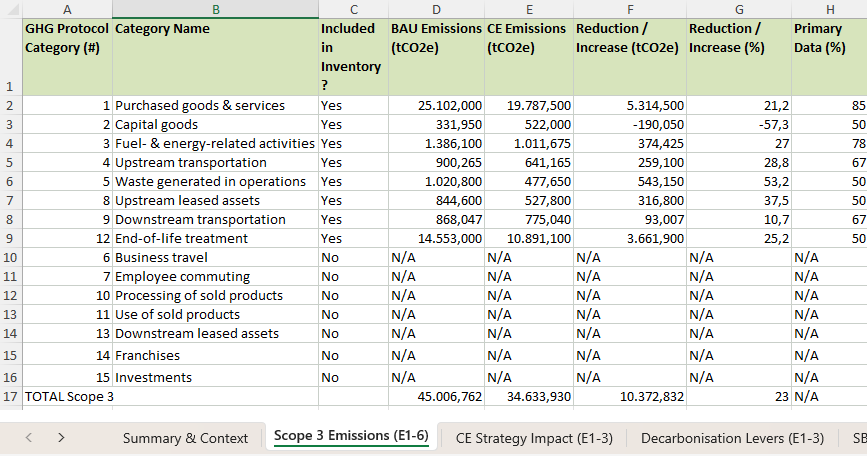
The ESRS E1 Excel export: a sheet listing every GHG Protocol Scope 3 category as included or excluded, with baseline and circular emissions, the change, and the share of primary data behind each one — alongside tabs for Summary & Context, CE Strategy Impact, Decarbonisation Levers and SBTi Target Progress. Add figures/tool-esrs-export.png
the ESRS E1 export screen
The whole assessment as an ESRS E1 workbook in Excel: every Scope 3 category marked included or excluded, with the change and the share of primary data behind each line. Sample data shown.

See it run on your own numbers

Book twenty minutes and I will walk you through CS3 on a live assessment for free: which strategies have the strongest carbon performance, which of them pay back, and what a disclosure-ready export actually looks like.

If you would like to see it on your own data, send me one product line, packaging portfolio or site before the call and I will have it modelled by the time we speak.

Anything you send stays between us. Anonymised data works just as well.